The world’s top million websites received 1.970 trillion visits in the third quarter of 2026, 12.2% fewer than at their peak in the first quarter of 2022. The figures come from a study published on November 10, 2026, by SparkToro, a company that makes audience research software. The study set out to test whether the biggest sites were taking a growing share of traffic from smaller ones. It mostly found a shrinking total: large and small sites alike get fewer visits than in 2022, and the split between them has barely moved.
Rand Fishkin, SparkToro’s co-founder and CEO, wrote the study. It covers the open web, meaning the websites people visit in a browser. Traffic inside apps is not included. The data comes from Similarweb, a company that estimates website traffic from a global panel of internet users.
The study also draws on DataReportal, a website that publishes statistics on internet use. By its estimates, the number of internet users grew about 24% between late 2021 and the third quarter of 2026. From those numbers, SparkToro concludes that visits per internet user fell 29.2%. Search Engine Journal, a news site that covers search engines, points out that this figure depends on user estimates that were revised partway through the period.
Visits have fallen since the 2022 peak
Fishkin asked Similarweb for the total monthly visits to the top million sites, counting both desktop and mobile. The study covers 20 quarters, or five years, from the fourth quarter of 2021 through the third quarter of 2026.
The quarterly total peaked in the first quarter of 2022 at 2.243 trillion visits. It hit its low point in the first quarter of 2026: 1.914 trillion, or 14.7% below the peak. It has recovered slightly since, reaching 1.970 trillion in the third quarter of 2026.
SparkToro’s chart shows the total holding roughly level through the end of 2023. It dips in early 2024 and falls again in the first half of 2025. Search Engine Journal described the chart the same way in an article on November 12. In its view, the 12.2% drop in total visits is the study’s headline number that doesn’t depend on estimates of how many people are online.
The top 100 sites’ share barely moved
Fishkin suspected that the biggest sites, run by the largest tech companies, were taking a growing share of traffic from small and midsize sites. To test that hypothesis, Similarweb sorted the top million sites into five bands by rank: the top 10, ranks 11 to 100, 101 to 5,000, 5,001 to 100,000, and 100,001 to 1 million.
The split barely changed: “It appears that stagnation is a more accurate description of the trend,” Fishkin writes. The top 100 sites, which make up the first two bands, got about 33% of all visits in the fourth quarter of 2021. Their share reached about 36% in the third quarter of 2026. Each of the three lower-ranked bands lost between 0.4 and 1.6 percentage points of share over the same period.
SparkToro’s chart of each band’s share puts most of the top 100’s gain in a single quarter, from the first to the second quarter of 2025. The top 10’s share rose from 22.5% to 24.1% in that quarter, and ranks 11 to 100 went from 11.7% to 12.1%. Sites outside the top 100,000 fell from 12.7% to 11.5% in that quarter, then returned to 12.7% by the first quarter of 2026. The study doesn’t comment on the jump.
A steady share of a smaller total still means fewer visits. By MACCUS’s calculation from the published shares and totals, sites outside the top 100 lost about 16% of their visits. They fell from about 1.503 trillion visits in the first quarter of 2022 to about 1.257 trillion in the third quarter of 2026. The top 100 sites lost visits too, about 4% over the same period.
A per-user decline built on revised numbers
The study’s second finding is about visits per internet user. SparkToro uses DataReportal’s quarterly estimates: 4.95 billion internet users worldwide in the fourth quarter of 2021 and 6.15 billion in the third quarter of 2026. Dividing visits by those numbers, SparkToro gets a 29.2% drop in visits per user.
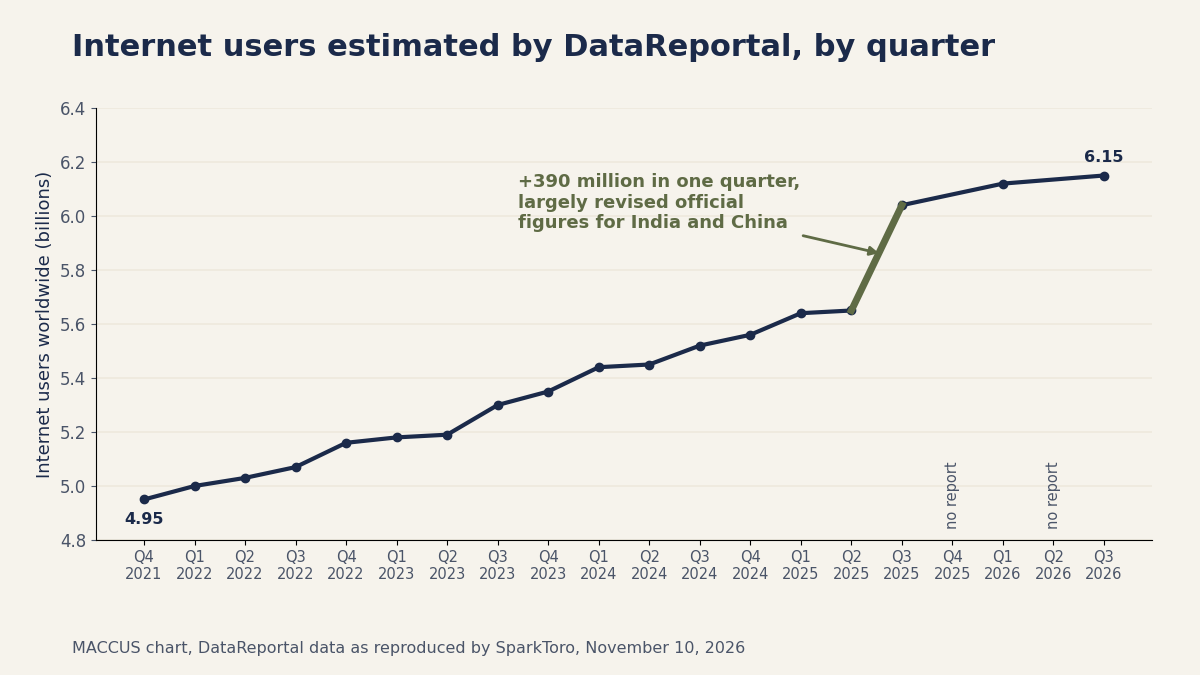
DataReportal’s estimate jumps from 5.65 billion to 6.04 billion internet users between the second and third quarters of 2025, an extra 390 million in three months. Its October 2025 report says this jump is “largely attributable to significant revisions” in official figures on the share of people online in India and China. It warns readers that the figures don’t mean hundreds of millions of people came online in 90 days.
Search Engine Journal points out that SparkToro’s study doesn’t mention the revision. According to the site, the roughly 24% growth in internet users compares figures from before and after the revision. The 29.2% drop in visits per user depends on that comparison, it adds.
A same-day correction left mismatched figures
The first version of the study reported a 24% drop in traffic, according to Search Engine Journal. It was corrected the same day. On November 10, Fishkin wrote on X, the social network formerly called Twitter, that he had deleted an earlier post. He said that post “had an incorrect graph/data” and that the full report had been updated.
The study’s web address still contains “fallen-24-in-5-years,” carried over from the first version’s headline, according to Search Engine Journal. The corrected study’s body text still says total visits have “fallen ~10%,” while the headline says 12% and the closing summary says 12.2%.
Limits Fishkin acknowledges
Fishkin names several limits in his own data. Similarweb’s panel measures only visits made in a web browser, on desktop or mobile. “In the app world, consolidation and domination by Big Tech is likely far more prevalent,” he writes.
The figures are also global. Fishkin says it is plausible that traffic to sites in the US, the UK and the European Union declined while traffic in other regions grew. Asia and Africa, for example, have seen strong growth in internet users and web use over the past five years, he notes. Search Engine Journal points out that the study gives no regional breakdown and doesn’t state the panel’s size.
Fishkin floats several possible causes without settling on one: “We can’t say for certain,” he writes. More people may now use the internet only through apps. Search engines, AI tools and social networks may be reducing people’s need, or desire, to visit more websites. The effect of the COVID-19 pandemic may also be wearing off, since 2021 and 2022 saw especially heavy internet use during lockdowns.
Search Engine Journal also notes that SparkToro sells audience research software and that Fishkin co-wrote the book “Zero Click Marketing.”
What it means
The study doesn’t support Fishkin’s starting hypothesis. The split between large and small sites has barely moved, and even the top 100 sites get fewer visits than they did in 2022.
The overall number of visits fell, and the sites outside the top 100 took most of the loss. Between the peak in early 2022 and the third quarter of 2026, the quarterly total dropped by 273 billion visits. By MACCUS’s calculation, those sites lost about 246 billion of them, roughly nine in ten.
Both headline figures have limits. The 12.2% figure rests on a single source, Similarweb’s panel. The 29.2% figure also depends on internet user estimates that were revised midway. Neither shows where the lost visits used to come from, or how much of the decline traces back to Google, social networks or apps.
Other recent research, on a much smaller set of sites, looks at the traffic Google and AI assistants send to websites. Marie Haynes, a consultant who helps websites rank in search engines, tracked 100 sites for 12 months. On those sites, the AI assistant ChatGPT sent the equivalent of 0.62% of the visits that came from Google’s regular, unpaid search results. The details are in our article on ChatGPT traffic.
Some publishers also object to Google features that can replace a visit to their sites. On October 29, five French trade groups representing website publishers filed a complaint with the European Commission, the European Union’s executive arm. The complaint targets Google’s AI Overviews and AI Mode, two features that show AI-written answers inside Google Search itself.
The study puts no number on any single market, including Europe and France. Search Engine Journal suggests treating it as a global picture until a regional breakdown exists.
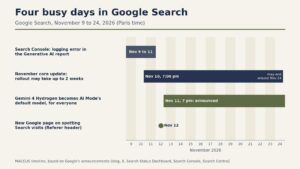
For now, the traffic Google sends to websites is also harder to interpret. Google’s November 2026 core update, a broad change to how the search engine ranks results, has been rolling out since November 10. It will muddy traffic charts until the rollout ends, which Google said could take up to two weeks.
Fishkin says he wants to check these findings against other sources and rerun the numbers every year or two. Two things are worth watching. The first is whether a panel other than Similarweb’s confirms the decline. The second is a regional breakdown that would show whether European sites are losing visits faster than the global average.
Sources
- New Research: Traffic to the Open Web Has Fallen 12% in 5 years; Visits/web User Are Down 30%, SparkToro (Rand Fishkin), November 10, 2026
- Note: I deleted a previous version of this tweet, which had an incorrect graph/data, Rand Fishkin on X, November 10, 2026
- Digital 2026: internet users pass the 6 billion mark, DataReportal (Kepios), October 15, 2025
- Top Million Sites Lost 12% Of Visits; Top 100’s Share Barely Moved, Search Engine Journal (Matt G. Southern), November 12, 2026
- GEO is a distraction, Marie Haynes, October 21, 2026
Header image: MACCUS chart, data from SparkToro and Similarweb, November 10, 2026