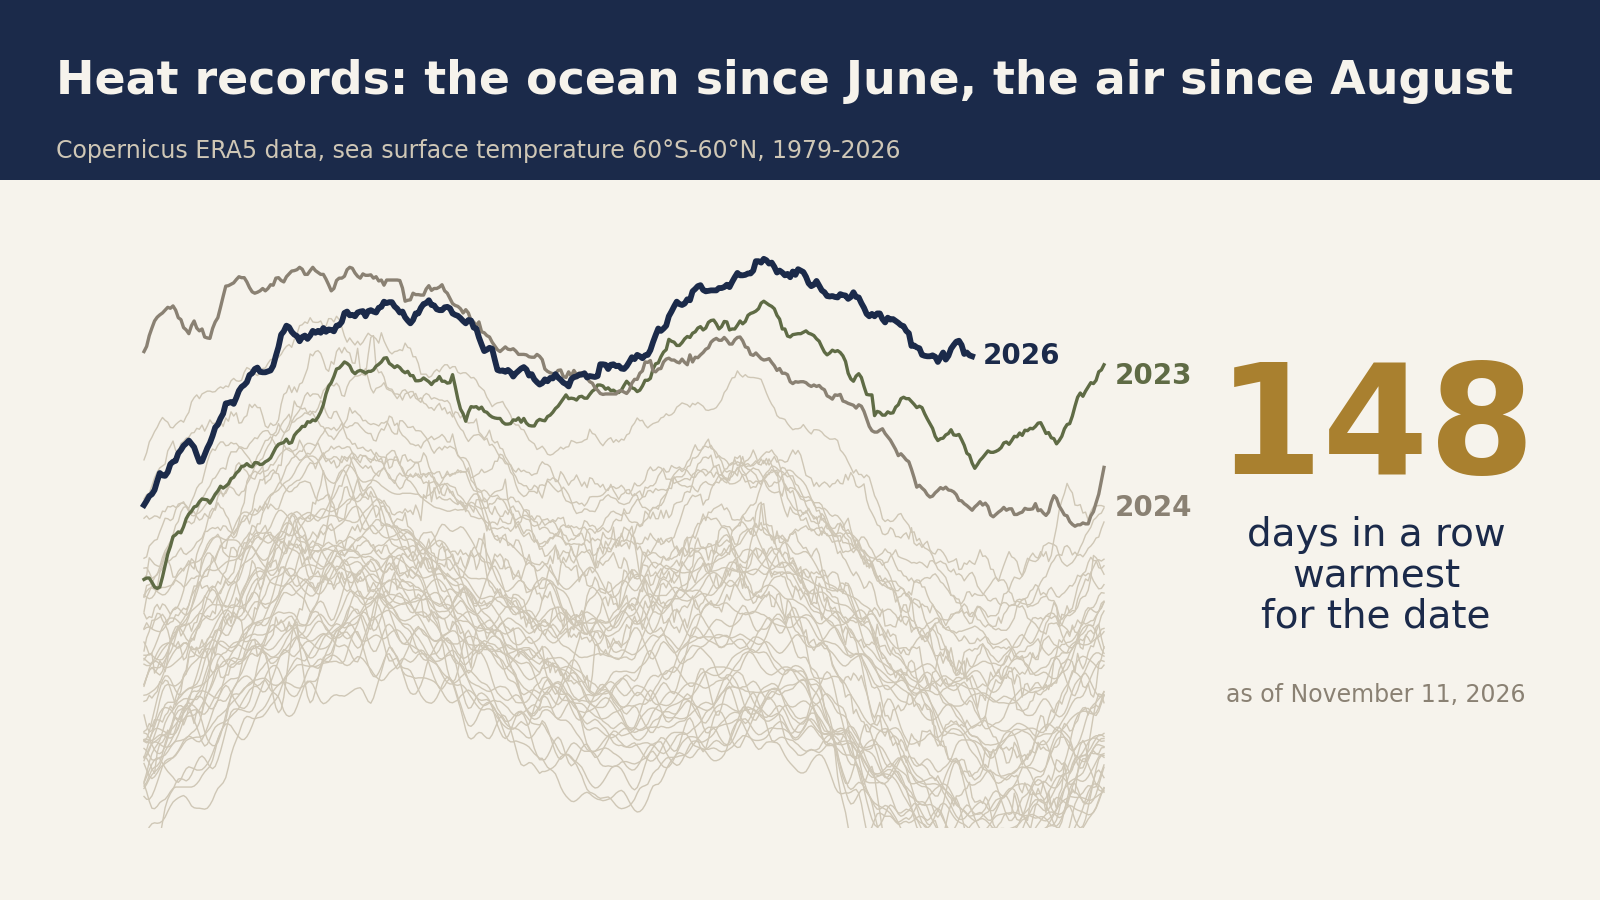

Every day for almost five months, the sea surface outside the polar regions has been warmer than on the same date in any earlier year on record. Global air temperature has also set a record for its date on most days since August. El Niño, a periodic warming of the tropical Pacific, is still building. In the past, the year after a strong El Niño has almost always run hotter, which points to 2027 as the next record year.
I compared each day of 2026 with the same date in every earlier year, using the daily global data published by Copernicus, the European Union’s climate service. Its air data goes back to 1940 and its sea surface data to 1979. Then I checked what global temperature did in the year after each strong El Niño since 1950.
The ocean has not had an ordinary day since June
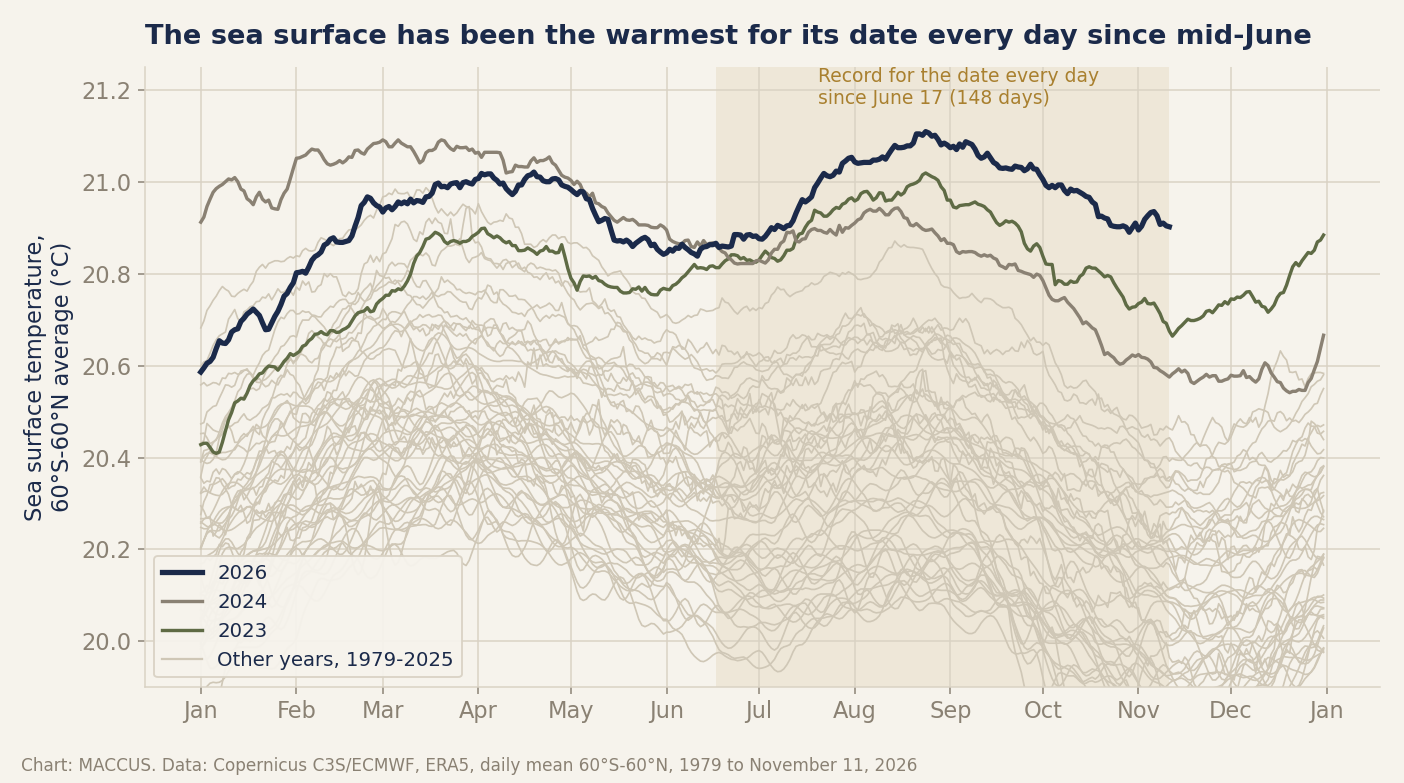
The streak began on June 17 and was still running on November 11, the latest day in the data. On most of those days, the previous record for the date had been set in 2023, the year the last El Niño took hold. On August 24, the sea surface also reached its highest daily average in the whole series. It edged past the high of March 2024 by a hair.
Water holds heat far longer than air does. A streak this long at the surface means the extra warmth is stored in the system, rather than passing through in a single hot week. Streaks like this one have run longer before: in 1997-98, 2015-16 and 2023-24, all of them El Niño years.
The air followed in August
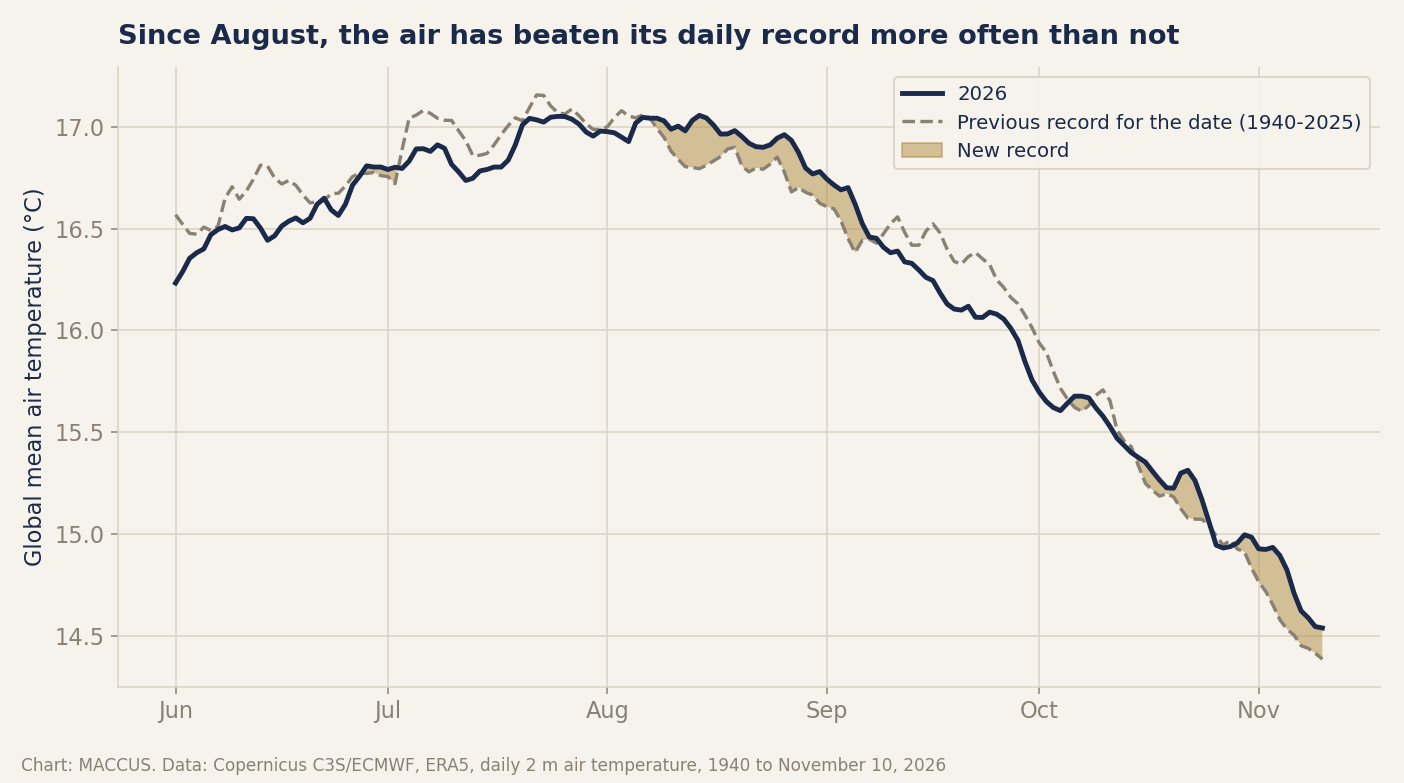
Records are harder to set in the air. Air temperature swings more from day to day than sea temperature. Most of the records it had to beat were set in 2023 and 2024, the warmest years ever measured.
Even so, more than half the days from August 1 through November 10, the last day with final data, were the warmest for their date since 1940. The share of record days has risen through the fall.
On November 3 and 4, global air temperature was about two degrees Celsius above the average of the late nineteenth century. Scientists call that baseline pre-industrial. The comparison uses Copernicus’s own conversion to that baseline. Before November 3, the series had reached that level only in November 2023 and February 2024, during the last El Niño.
The Paris Agreement’s warming limits refer to averages over decades, so a single day says nothing about them on its own. Those days do show how far the daily swings now reach.
Copernicus has already called October 2026 the warmest October on record. Its statistical model says 2026 will most likely finish second-warmest on record, behind 2024.
The El Niño is still building
During an El Niño, the surface of the eastern tropical Pacific runs warmer than usual. While it lasts, the ocean there releases heat into the air, and rainfall patterns shift around the world.
On November 12, the Climate Prediction Center, the US government’s seasonal forecaster, said this El Niño is still strengthening. The center said it will likely stay strong to very strong through March, and it expects the event to weaken early next year. The center measures El Niños on an official index. It gives about three chances in five that this one will surpass every El Niño since 1950 on that index.
The timing matters because global temperature follows the Pacific with a delay. Across the whole record, that delay is about a season. If the pattern holds, the warmest months of this episode are still ahead, in early 2027.
After a strong El Niño, the next year runs hotter
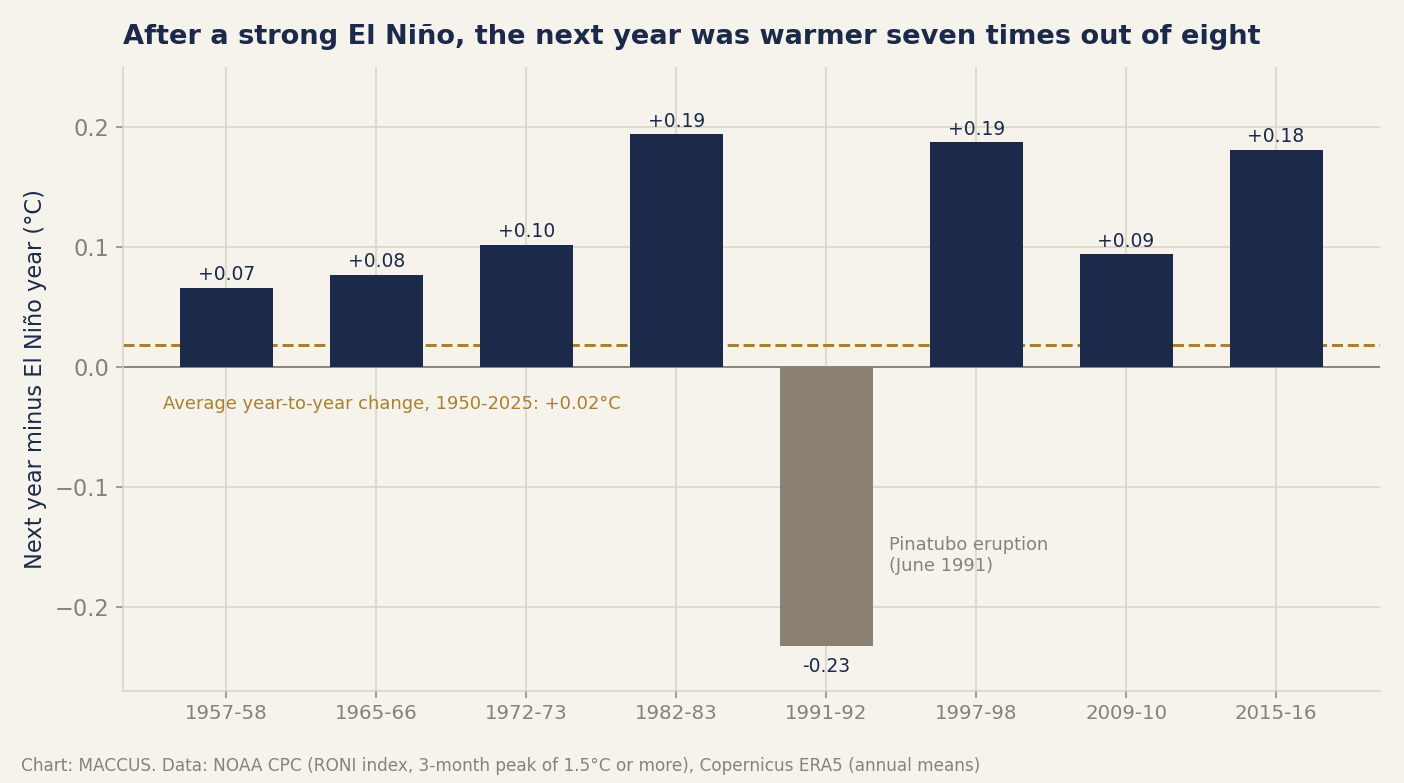
After seven of the eight strong El Niños since 1950, the next calendar year was warmer than the year the event formed. The exception is 1992, which came out cooler than 1991. That drop is widely attributed to the eruption of Mount Pinatubo in the Philippines in June 1991.
The eruption put a haze of sulfuric acid droplets into the upper atmosphere, and the haze scattered part of the incoming sunlight. The large eruption of El Chichón in Mexico in 1982 did not stop 1983 from coming out warmer than 1982.
The count of warmer years is less striking than it sounds. The long-term warming trend alone makes any year more likely than not to be warmer than the one before.
The size of the rise is the stronger evidence. After the biggest events, in 1982, 1997 and 2015, the next year warmed about ten times as much as a typical year does.
What it means
Greenhouse gases set the long-term trend, and an El Niño lifts one year above it. Each El Niño now starts from a higher floor than the last. That is why the records of 2023 and 2024 are under threat again so soon after they were set.
| Year | Global average above 1850-1900 | What the figure is |
|---|---|---|
| 2023 | 1.48°C | Measured (ERA5) |
| 2024 | 1.60°C | Measured (ERA5), warmest year so far |
| 2025 | 1.47°C | Measured (ERA5) |
| 2026 | 1.56 to 1.61°C | Copernicus estimate (October 2026 bulletin) |
| 2027 | about 1.63 to 1.80°C | 2026 estimate plus the rises seen after past strong El Niños, except the one after Pinatubo |
Suppose 2026 ends where Copernicus expects and 2027 repeats one of the rises seen after past strong El Niños. Every past rise except the one after Pinatubo would put 2027 above 2024. That is plain arithmetic on a past pattern, and no climate model went into it.
COP31, the United Nations’ yearly climate summit, runs in Antalya, Turkey, until November 20. The talks are about emissions, which move on a slower clock than the Pacific. Solar became the European Union’s biggest source of electricity this summer, electric cars outsold gasoline and diesel cars combined in the EU in September and Chinese buyers are turning away from gasoline-only cars. None of that will show up in a single year’s temperature.
My bet is that 2027 will be the warmest year in the Copernicus record, and that Copernicus will say so in early January 2028. I would put the year at about 1.7 degrees above pre-industrial. That is the middle of the range in the table, so that part of the bet is close to a coin flip.
The daily figures come from a reanalysis: a weather model kept in line with real observations. The reanalysis is less certain before satellites arrived in 1979, and the sea series leaves out the polar oceans. The 2027 range in the table assumes this El Niño behaves like past strong ones. The one exception since 1950 followed Pinatubo, and an eruption of that size would break the pattern again.
Method and numbers
All temperatures come from the Copernicus Climate Change Service ERA5 daily global series (Climate Pulse), retrieved November 13, 2026. Only days marked final count. The sea series is the average sea surface temperature from 60°S to 60°N. A day is a record when it is warmer than the same date in every earlier year. The sea streak runs 148 days, from June 17 to November 11; the record it beat had been set in 2023 on 134 of those dates and in 2024 on 14. On August 24, the sea surface reached 21.11°C, against 21.09°C in March 2024. From August 1 to November 10, 59 of 102 days were air records, including 24 of the last 30, and the median margin over the old record was 0.13°C. Pre-industrial values use the Copernicus daily offset to the 1850-1900 average; November 3 and 4 came out at about 2.0°C. A strong El Niño is a three-month peak of 1.5°C or more on the Relative Oceanic Niño Index (RONI) of NOAA, the US National Oceanic and Atmospheric Administration; the index stood at +1.97°C for August-October 2026. Since 1950, the eight strong events were followed by rises of +0.07 to +0.19°C, except after Pinatubo (-0.23°C). A typical year (1950-2025) rose by 0.02°C, and a year was warmer than the one before 56% of the time, so the count alone could be chance. Five of the eight following years set a record at the time. Counted in July-to-June years instead, the warm year is the El Niño year itself, so the result applies to calendar 2027 only. The full dataset is available here.
Sources
- Climate Pulse, Copernicus Climate Change Service (C3S) and ECMWF, retrieved November 13, 2026 (ERA5 daily series: air temperature, sea surface temperature)
- Surface air temperature for October 2026, Copernicus Climate Change Service, retrieved November 13, 2026
- Climate bulletin: about the data and analysis, Copernicus Climate Change Service, retrieved November 13, 2026
- ENSO: Diagnostic Discussion, NOAA Climate Prediction Center, November 12, 2026 (archived copy)
- Relative Oceanic Niño Index (RONI), NOAA Climate Prediction Center, retrieved November 13, 2026
- Global Effects of Mount Pinatubo, NASA Earth Observatory, June 15, 2001
- UN Climate Conference COP31, UN News, retrieved November 13, 2026
Header image: chart by MACCUS, data from Copernicus C3S/ECMWF (ERA5 daily sea surface temperature), November 11, 2026.