Almost three years after missile and drone attacks drove cargo ships out of the Red Sea, they have not come back. The Suez Canal today moves a little over half the cargo it carried before the attacks began, and the ships that left are still taking the long way around the southern tip of Africa. I pulled the daily traffic data for the world’s shipping chokepoints to see whether the detour was finally easing. It has set in.
The International Monetary Fund publishes a daily count of how many ships pass each major maritime passage, estimated from their satellite positions, running back to 2019. I compared the most recent full month of 2026 against the daily average across the calm stretch of 2023, the last stable period before the attacks began that November.
The lines crossed at the end of 2023
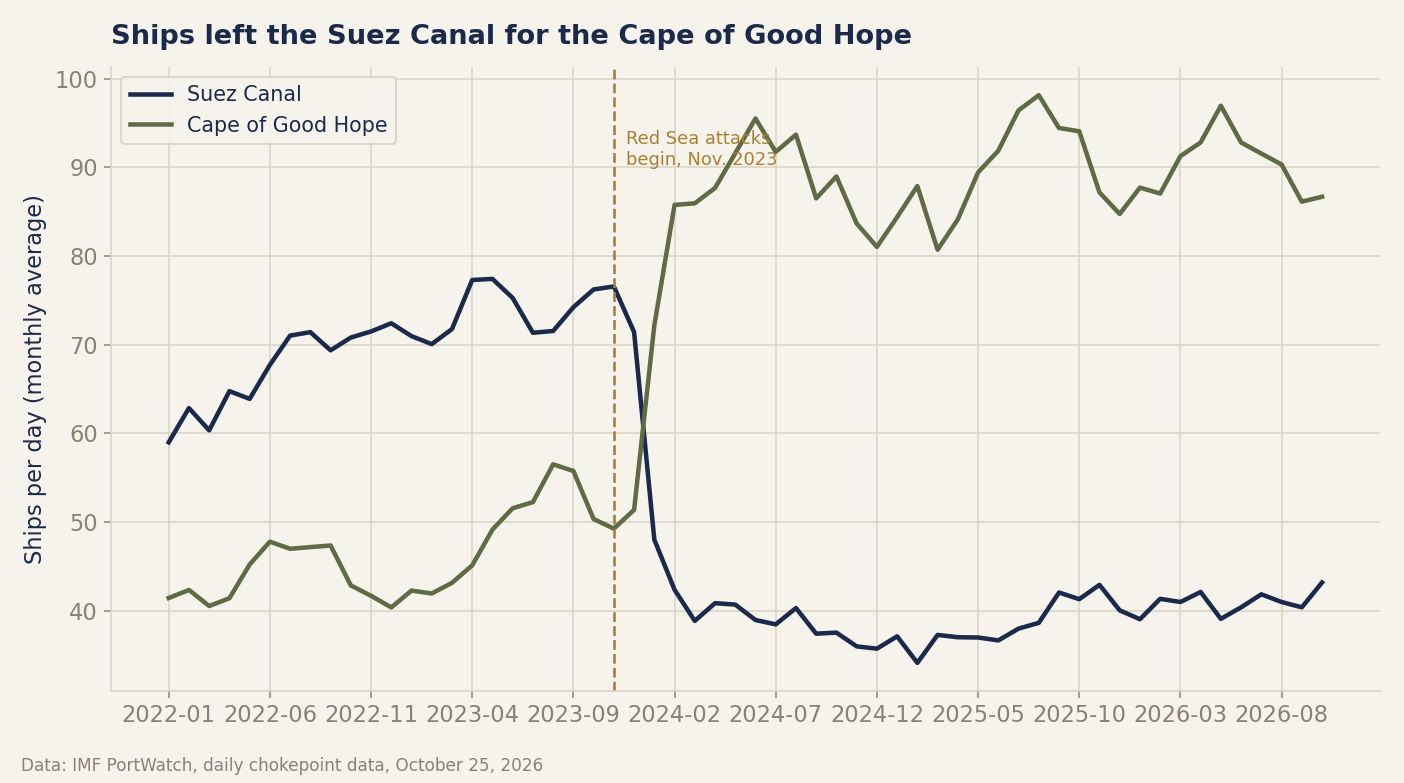
The clearest way to see it is two lines that trade places. Through 2022 and most of 2023, the Suez Canal carried far more ships each day than the Cape of Good Hope. At the end of 2023 they swapped, and they have stayed swapped. Traffic around the Cape of Good Hope is now close to double its pre-crisis level. The route was a backwater for container ships; now it is a highway.
A container ship leaving Shanghai for Rotterdam no longer cuts through Egypt. It sails the length of Africa and climbs the Atlantic to reach the same port, a voyage its operators chose because the shorter road runs past the Yemeni coast and the missiles fired from it. What the chart shows is that almost nobody has chosen to go back.
Measured by cargo weight rather than by headcount, the fall at Suez is slightly deeper than the fall in the number of ships. That matters, because it closes off the reassuring explanation that fewer but larger vessels are quietly carrying the same freight. The ships still using the canal are, if anything, a little smaller than before.
The southern gate is still mostly shut
The Bab el-Mandeb strait is the narrow door at the southern end of the Red Sea, the water every Suez-bound ship from Asia must pass. Traffic there is down by nearly two thirds. It is a cleaner measure of the diversion than the canal itself, because the canal still draws local and regional trade that never faced the missiles.
The break was sudden. The canal’s daily traffic fell by about a third in a single month, January 2024, as the attacks took hold. Then it settled onto a low shelf and stayed there for two years.
World shipping did not move
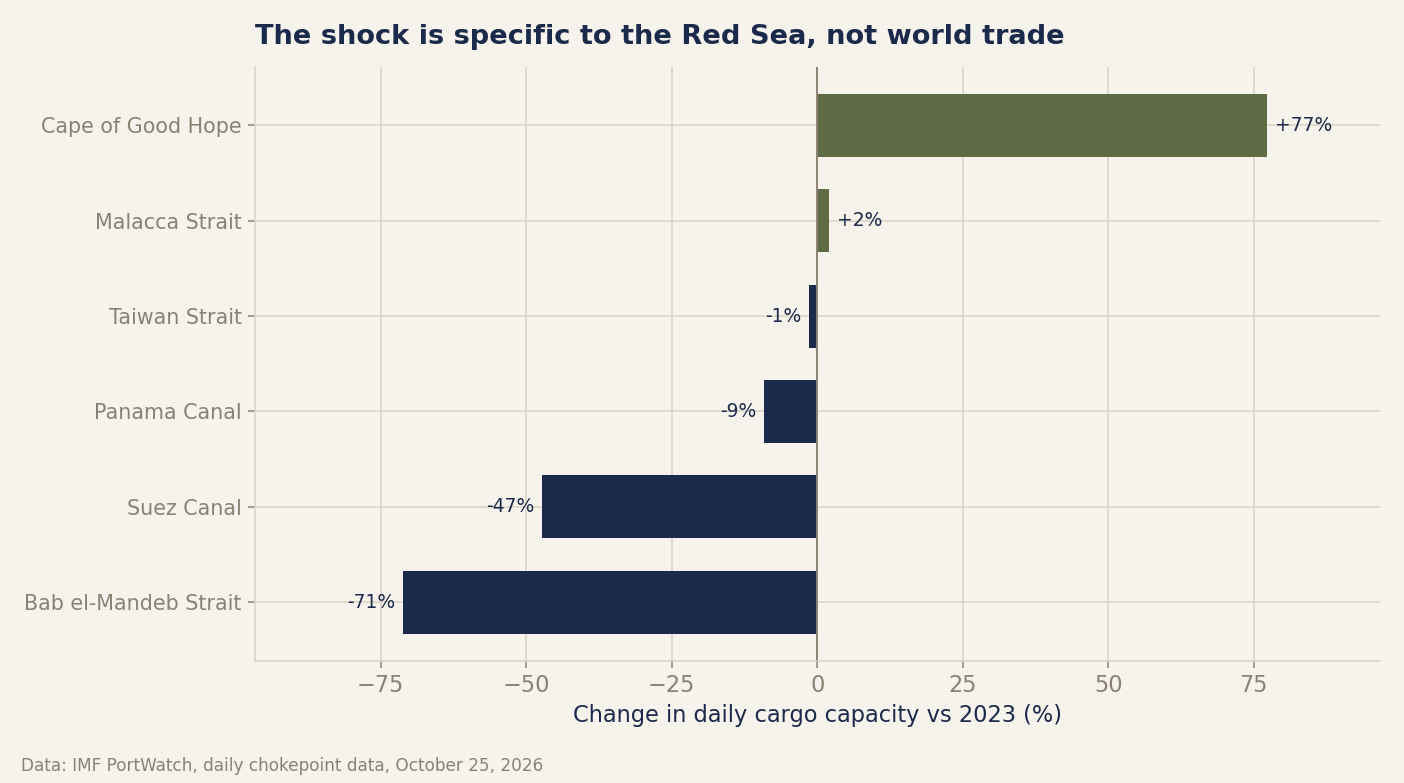
A collapse at one set of passages could mean a slump in world trade rather than a detour. The data says otherwise. The cargo moving through the Malacca and Taiwan straits, the great arteries of Asian trade, barely changed over the same period, each staying close to its 2023 level. The Panama Canal is down against its 2023 figure, but that is the aftermath of its own drought, which has largely passed. The shock belongs to the Red Sea alone.
Carriers said they were coming back
A Gaza ceasefire in October 2025 quieted the attacks, and early this year a few large carriers announced that selected services would return to the Red Sea. The traffic data shows how little followed. October 2026 was the busiest month the Suez Canal has seen since the collapse, and it was still about two fifths below where it started. The ships have trickled back. No surge came.
What it means
What began as an emergency has hardened into the ordinary map of trade. The Cape route has absorbed much of the cargo the Red Sea lost. The rest is explained by trade that simply stopped and by fuller ships on the voyages that remain. Insurance, port schedules and delivery promises have all been rebuilt around the longer path. A route change of that size does not reverse on a quiet month; it reverses on many quiet months, plus a reason to believe the quiet will last.
A shift this large stays invisible until someone adds up the daily traffic, much like the concentration of orbital launches by mass, China’s turn away from the gasoline car, or the month solar became the European grid’s biggest source, each of which surfaced only once the public data was counted.
For Europe, which sits at the receiving end of the Asia trade, the detour is a standing charge on almost everything that arrives by sea. Rounding Africa instead of cutting through Suez adds many days at sea and a heavy fuel bill to every large sailing. That cost reaches the shelf price of goods long after the headlines about the Red Sea have faded.
My read is that the canal stays well below its old self for a long time yet. If the pattern of the past year holds, Suez traffic will still sit under two thirds of its pre-crisis level a year from now, in late 2027, ceasefire or not. These are estimates built from ship positions rather than the canal’s own ledger, so the exact level is approximate, though the direction and the scale of the change are firm. And the Cape of Good Hope is a single point on a long route, so it shows the detour without accounting for every ton that left the Red Sea.
Method and numbers
The source is the IMF PortWatch Daily Chokepoints Data, which estimates daily ship transits and total cargo capacity at each maritime passage from vessel tracking signals, with the University of Oxford. The baseline is the daily average over January to October 2023, the last full pre-attack stretch; “now” is the latest thirty complete days, September 26 to October 25, 2026, and the October month-to-date agrees with it. Suez transits are down about 42 percent and cargo capacity about 47 percent; container transits down about a third, tankers rather more. Bab el-Mandeb is down about 62 percent by ships and 71 percent by capacity. The Cape of Good Hope is up about 76 percent by ships and 77 percent by capacity. Malacca and Taiwan are within two points of their 2023 capacity. As a cross-check on the detour, the Cape of Good Hope gained about 2.3 million tonnes of daily cargo capacity while the Red Sea corridor lost about 4.0 million, so the Cape accounts for roughly 58 percent of the fall; the measure is directional, not an exact accounting, because the Cape is one waypoint and some lost traffic was regional or absorbed by fuller ships. The Strait of Hormuz is left out: its PortWatch series breaks in March 2026 in a way no real event explains, which marks a coverage change in the data, not a change in traffic. The full daily series for every chokepoint is available here.
Sources
- Daily Chokepoints Data (data and methodology), IMF PortWatch, retrieved November 6, 2026
- PortWatch, real-time monitoring of trade disruptions, IMF PortWatch, retrieved November 6, 2026
- Red Sea, Black Sea and Panama Canal: UNCTAD raises alarm on global trade disruptions, UNCTAD, retrieved November 6, 2026
- Shipping giants sail cautiously back into Red Sea despite Houthi threats, Al-Monitor, September 2026
- Red Sea crisis, Wikipedia, retrieved November 6, 2026
Header image: chart by MACCUS, data from IMF PortWatch (daily chokepoint data), October 25, 2026.