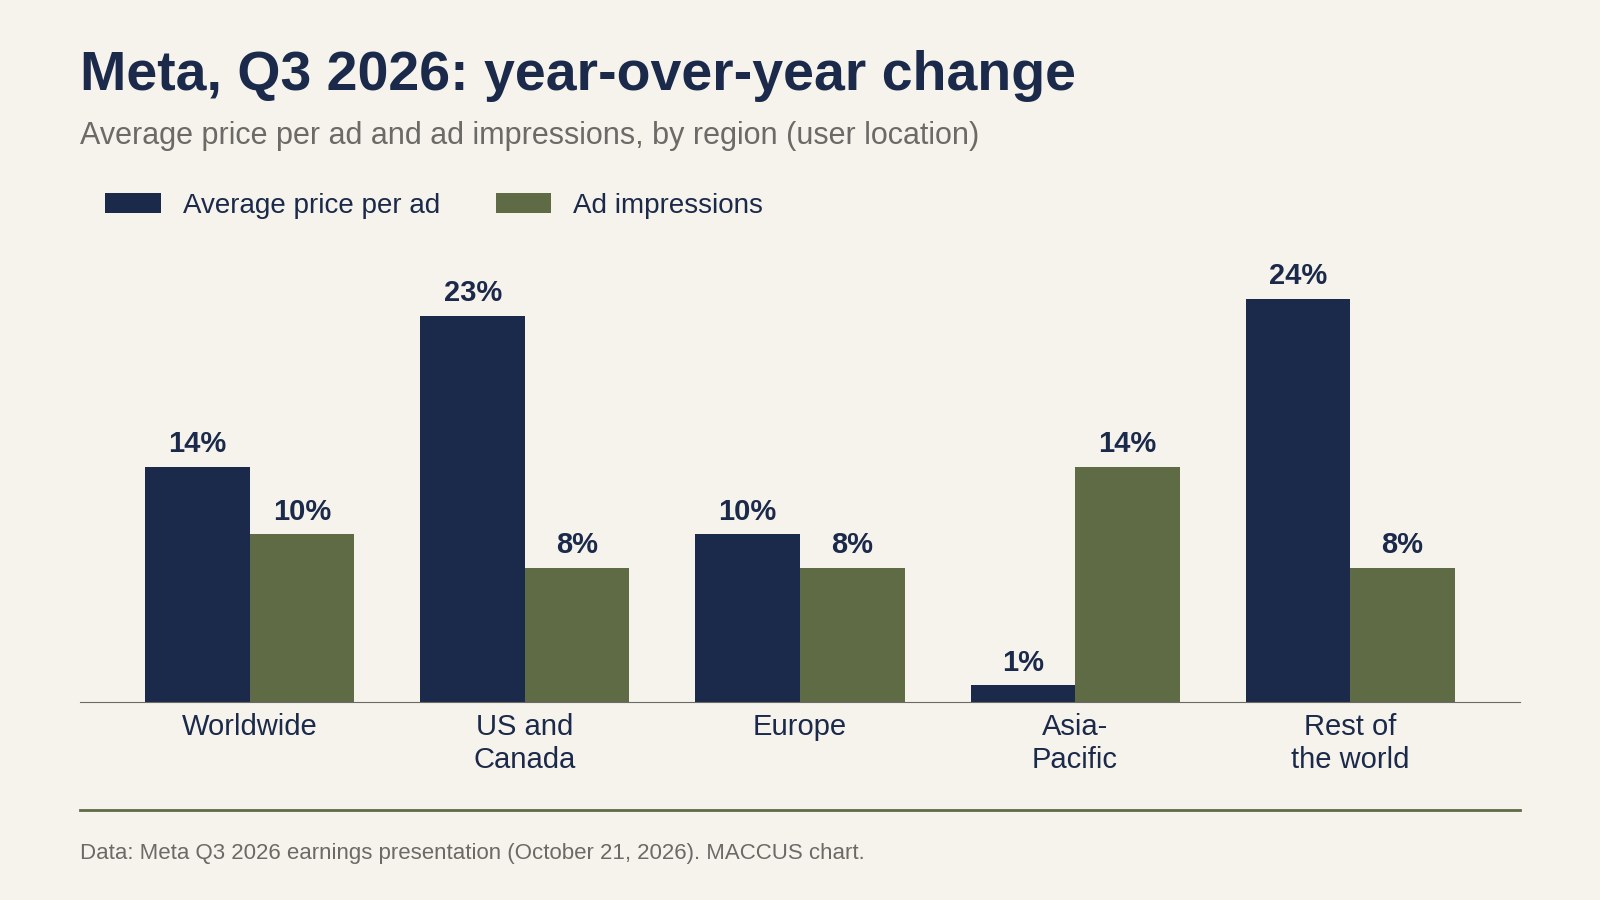

The average price of an ad on Meta’s apps (Facebook, Instagram, Messenger, WhatsApp and its other services) rose 14% year over year in the third quarter, which ended September 30, while the number of ad impressions grew only 10%. Meta released the figures on Wednesday, October 21, 2026, with its quarterly results. Both increases were smaller in Europe: 10% for the average price per ad and 8% for impressions.
Worldwide, the average price per ad grew faster than the number of ads served for the first time in the five quarters Meta presented to investors.
Revenue up 26%
Meta’s revenue rose 26% to $64.6 billion (about €57.5 billion at the European Central Bank’s October 21 reference rate of $1.1234 per euro). Advertising brought in $63.06 billion (€56.1 billion), also up 26%. In September, an average of 3.64 billion people used at least one of the company’s apps every day, 3% more than a year earlier.
Operating income fell 37% to $12.99 billion because of a $9.89 billion charge tied to the agreement Meta reached in August with 52 US state attorneys general to settle litigation over teen mental health. Excluding that charge, operating income would have been $22.88 billion, according to the press release.
For the fourth quarter, which includes Black Friday and the holiday season, Meta expects revenue of $73 billion to $76 billion (€65 billion to €67.7 billion), 22% to 27% more than in the fourth quarter of 2025 ($59.9 billion). According to CNBC, the midpoint of that range is above the $73.73 billion analysts were expecting. Meta will also turn on product browsing in existing ads by default on October 28, and its new commercial terms take effect on October 30.
A 10% rise in the average price per ad in Europe
Meta’s investor presentation breaks these metrics down by region, based on where it estimates the user is when the ad is shown. The advertiser’s country is not a factor. The average price per ad rose 23% in the US and Canada, 24% in “rest of world,” 10% in Europe and 1% in Asia-Pacific.
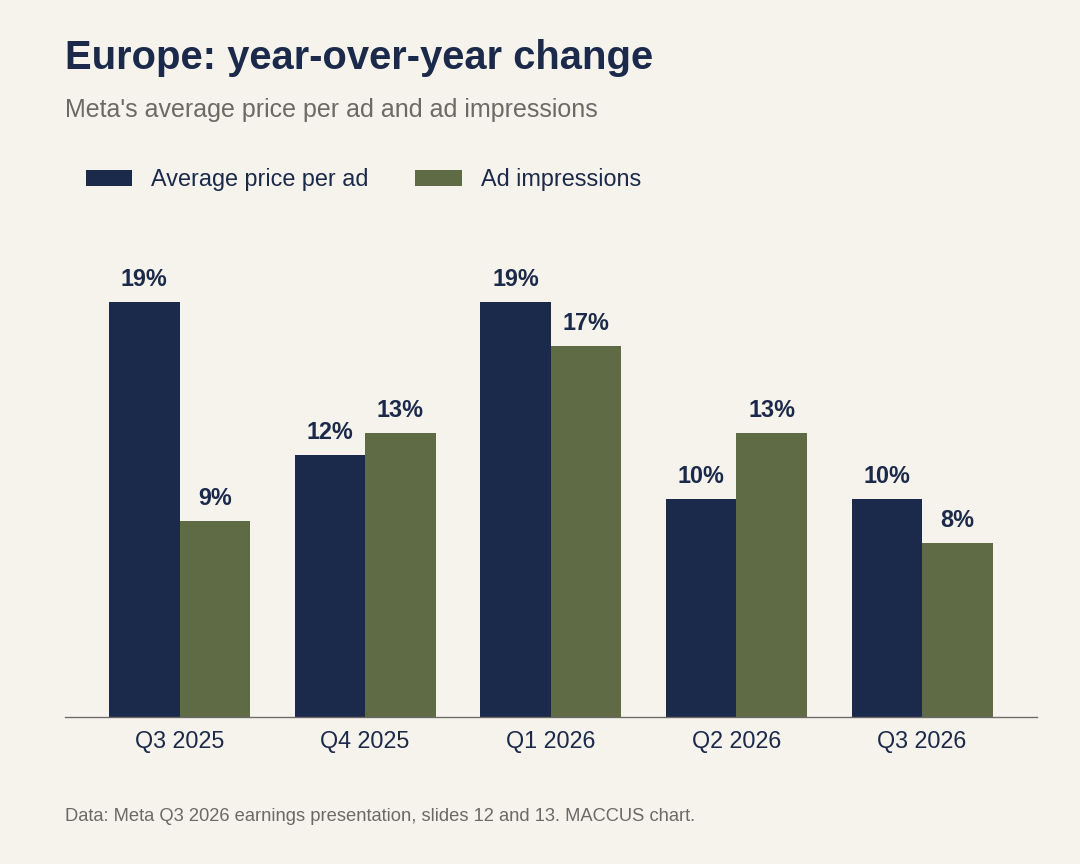
Europe remains Meta’s second-largest ad region after the US and Canada, with $14.23 billion in third-quarter ad revenue (€12.7 billion), compared with $12.07 billion a year earlier, an increase of about 18%. Growth in the average price per ad there dropped from 19% in the first quarter to 10% in the second and held at 10% in the third. Impression growth slowed from 17% to 13%, then to 8%.
The presentation gives no country-level figures. France and Belgium are included in the Europe region and are not broken out.
Susan Li’s explanation
On the earnings call, CFO Susan Li attributed the higher average price to “ad performance gains and improvements in macro conditions relative to Q3 of last year.” She said the increase was partially offset by strong impression growth, “particularly from lower-monetizing surfaces and regions.”
She credited impression growth to higher engagement and user growth, as well as “ad load optimizations,” and called it “healthy across all regions.” The trade site PPC Land notes that ad load is the share of content slots given to ads. In PPC Land’s view, some of the extra impressions came from showing more ads per session, on top of the rise in usage.
Meta puts numbers on its AI models
Li gave several figures for the AI models that pick which ads people see. Meta’s GEM ranking model, now running on more surfaces, increased conversions by 1.7% for campaigns optimized for offsite conversions and by 9.6% for app ads, according to the company. Improvements to the Andromeda retrieval system increased conversions on Facebook by 1.4%. The Generative Recommender, launched in the Facebook Feed, lifted conversions by nearly 2% across targeted segments, she said.
Nearly 10 million advertisers used at least one of Meta’s generative AI ad creative tools in the third quarter, the company said. Advertiser adoption of its video generation features grew 25% from the previous quarter. On October 6, Meta announced new features for its advertising assistant and for video creation (see our coverage of the Meta Ads AI tools announced at Advertising Week).
Meta estimates that advertisers who adopted the recommendations of Meta AI Business Assistant drove almost 5% more conversions at the same cost per conversion and increased their ad spend by 9%, compared with similar advertisers who did not.
Partnership ads, which let an advertiser run an ad with a creator, a brand or another business (a paid form of influencer collaboration), grew more than 97% year over year. Their annual revenue run rate is now above $15 billion (€13.4 billion). In the third quarter, Meta also finished rolling out its Creator Marketing Hub to all advertisers worldwide. The hub combines creator discovery and partnership ad activation and lists more than 10 million creators.
Gains measured by Meta itself
All of these conversion figures come from Meta’s internal measurements. As PPC Land points out, none came with a test methodology or a baseline. The comparison with “similar” advertisers who did not follow the assistant’s recommendations is a company estimate, and Meta did not describe its methodology.
PPC Land also points to a mismatch between Li’s wording and the numbers. Li described impression growth as “strong,” yet the third quarter’s 10% is the slowest pace of the five quarters in the presentation. The site adds that Li named no region or surface when she referred to “lower-monetizing” ones, and that no analyst asked her about ad prices or what advertisers pay.
The average price per ad also blends formats, placements, industries and advertisers of every size. It says nothing about the cost per thousand impressions or the cost per click of any given campaign.
What it means
In the third quarter, price did more than volume to drive Meta’s ad growth. In each of the four previous quarters, impressions grew faster than the average price per ad worldwide. The third quarter flipped that, with a 14% rise in price against 10% more impressions.
Meta attributes the higher price to better-performing ads and improved economic conditions. The performance claim rests on Meta’s own measurements, with no outside data. In Europe, the average price rose less than in the US and Canada (10% versus 23%), and impression growth has slowed more since the first quarter (from 17% to 8%, versus 13% to 8% in the US and Canada). Li called impression growth healthy in every region and did not comment on Europe.
Still unknown are the country-level breakdown, the effect on small advertisers compared with large brands, and how much of the impression growth comes from extra ads per session. Alphabet reports its results on Wednesday, October 28, according to CNBC. Meta’s next price and impression figures will come with its fourth-quarter results, for which it forecasts revenue of $73 billion to $76 billion.
Sources
- Meta Reports Third Quarter 2026 Results, Meta, October 21, 2026
- Meta Earnings Presentation Q3 2026, Meta, October 21, 2026
- Meta Platforms Q3 2026 Earnings Call Transcript, Benzinga, October 21, 2026
- Meta’s ads with creators gain 97% to a $15bn annual run rate, PPC Land, October 21, 2026
- Meta (META) Q3 2026 earnings report: Live updates, CNBC, October 21, 2026
- Euro foreign exchange reference rates, US dollar, European Central Bank, October 21, 2026
Header image: MACCUS chart, Meta data (Q3 2026 earnings presentation)