

You can build a Search Console dashboard in Looker Studio with Google’s free connector: two data sources, six calculated fields, eight filters and six pages. Every formula for the Looker Studio Search Console connector is given in a block you can copy, and a generator writes the regular expression for your brand.
Menu names come from Google’s official documentation, checked on October 10, 2026. If a label differs in your interface, search for the setting by name. This page doesn’t link to a ready-to-copy template: the recipe is written so you can rebuild the report in your own account.
The dashboard in six pages
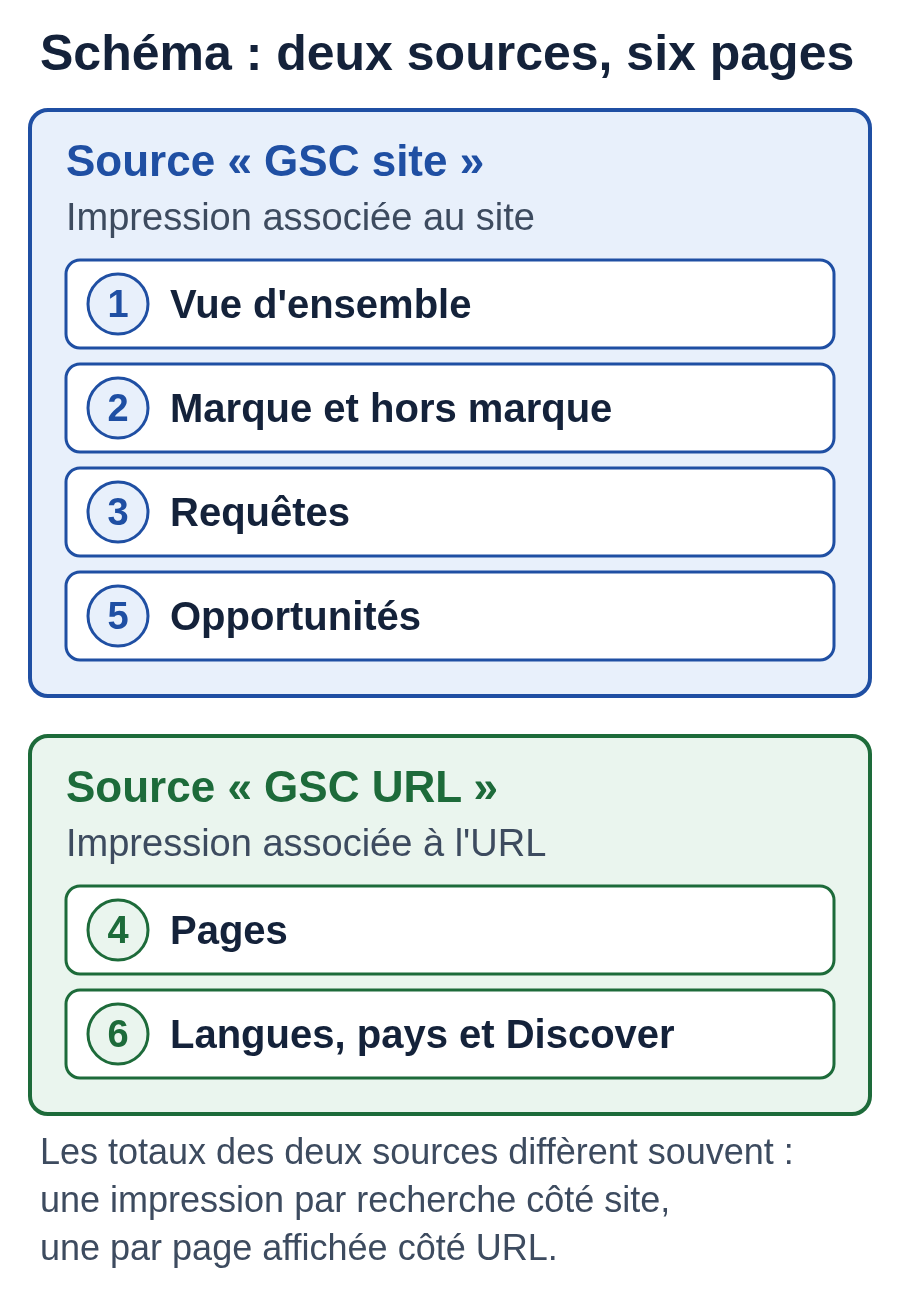
Each page answers a single question. Pages 1, 2, 3 and 5 read the “site” source, pages 4 and 6 the “URL” source (step 1 explains the difference).
| Page | Question | Source | Content |
|---|---|---|---|
| 1. Overview | Is traffic from Google going up? | Site | 4 key figures, clicks and CTR chart, controls for date, search type, device and country |
| 2. Brand and non-brand | Do clicks come from people who already know you? | Site | Chart by segment, table of the two segments |
| 3. Queries | Which searches bring you visitors? | Site | Table of queries with intent and length, bars by intent |
| 4. Pages | Which pages are gaining or losing clicks? | URL | Table of paths and sections, comparison with the previous period |
| 5. Opportunities | Where will content work pay off most? | Site | Bubble chart, table of positions 11 to 20 |
| 6. Languages, countries and Discover | How are your other markets doing? | URL | Language and country table, Discover view |
Looker Studio is called Data Studio again
Google renamed Looker Studio “Data Studio” on April 16, 2026, according to the product’s official release notes. It’s a return to the old name, which Google was still mentioning in March 2023. The Search Console connector and the formula functions are the same in the renamed tool; tutorials published before April 2026 talk about Looker Studio, hence both names in this guide.
Data Studio is free for creating and reading reports. Data Studio Pro costs $9 per user, per project, per month (Google Cloud page checked on October 10, 2026), or about €8 at the ECB rate of October 9, 2026; this dashboard doesn’t need it.
What you need before you start
You need a Google account with at least read access to the Search Console property. Sign in to Data Studio and Search Console with the same account, or the property won’t appear in the connector’s list.
Also write down the variants of your brand and the site’s language folders (/fr/, /nl/). The connector only carries performance data: clicks, impressions, CTR, average position. This data arrives with the same delay as in Search Console, which went over 60 hours in October 2026 (see our article on the Search Console delay). Indexing is tracked in Search Console itself, as our indexing guide explains. The cause and the action to take for each reason in the Page indexing report are in our table of Search Console indexing statuses.
Step 1. Create the two data sources
The connector offers two tables, and a data source can only use one. Google therefore recommends two sources in the same report. The procedure, according to the connector’s help page:
- Sign in to Data Studio.
- At the top left of the home page, click Create, then Data source.
- Choose the Search Console connector and click AUTHORIZE if prompted.
- In the Site panel, choose your property.
- In the Table panel, choose Site Impression.
- In the Search Type panel, keep Web.
- At the top right, click CONNECT, then rename the source “GSC site.”
- Repeat steps 2 to 7 with URL Impression, and name this source “GSC URL.”
Then create a blank report and add both sources to it: in the toolbar, click Add data, open the My data sources tab, choose the source, then click Add at the bottom right.
Site or URL, two ways of counting
The “site” table counts one impression per search, even if several of your pages appear in the same result. The “URL” table counts each page shown. Search Console’s help applies the same rule to its own report: data by query, country, device or date is aggregated by property, and data by page is aggregated by page.
The totals on page 1 and page 4 therefore often differ, especially for impressions: that’s the expected behavior. Use the “site” source for queries and the “URL” source for pages.
The “URL” table is also used for Discover: according to the connector documentation, the “site” table accepts the web, image, video and news types, and the “URL” table adds discover and googleNews.
Data credentials
At the top of the fields panel, you choose who sees the data. With the owner’s credentials, anyone who opens the report sees the figures without access to Search Console; with the viewer’s credentials, each person provides their own access. For a client or partner without access to Search Console, only the first option works, and it gives your data to anyone you share the report with: Google advises sharing it only with people you trust.
To show a one-off view, Search Console’s share button is enough: according to its help, the link only gives access to the current view of the report.
Step 2. Add the calculated fields
Create the fields in the data source: that way they work on every page and in the filters, whereas a field created in a chart stays specific to that chart. Open the source for editing, click ADD A FIELD, then Add calculated field, enter the name shown, paste the formula and click SAVE at the bottom right.
The formulas use the connector’s field names: Query and Landing Page. If your interface is in another language, the field may show a translated name. According to Data Studio’s help, a valid field name turns into a green or blue chip; if it doesn’t, delete it and click the right field in the list of available fields.
Two details prevent most errors. REGEXP_MATCH only returns true if the expression covers the whole value, while REGEXP_CONTAINS looks for the pattern anywhere; the formulas below use REGEXP_CONTAINS, except for counting words. They also have no backslashes: a period is written [.] and a question mark [?], which avoids the double escaping of Data Studio strings. Data Studio and Search Console both read RE2 syntax. Our 40 regex filters for Search Console can therefore serve as a starting point for your own fields.
Brand or non-brand
This field separates searches that contain your name from the others: brand clicks mostly track your brand awareness, while non-brand clicks mostly reflect SEO. The example uses an invented brand, “Atelier Lumen”; the generator below writes yours.
Field name: Brand or non-brand (GSC site source)
CASE
  WHEN IFNULL(Query, "") = "" THEN "Hidden queries"
  WHEN REGEXP_CONTAINS(Query, "(?i)atelier[ -]?lumen|lumen atelier|atelier lumem") THEN "Brand"
  ELSE "Non-brand"
END
The first line isolates the queries Google doesn’t detail: according to the connector documentation, rare or sensitive searches aren’t shown, and Data Studio can group them in a blank row. The (?i) prefix makes the match case-insensitive.
Search Console has its own branded queries filter, announced on November 20, 2025 and rolled out to all eligible sites on March 11, 2026. Google states that this filter doesn’t use a regular expression: an internal AI-assisted system classifies the queries, and only top-level properties with enough queries have access to it. The connector documentation, checked on October 10, 2026, doesn’t mention it, so in Data Studio the calculated field is still necessary. Compare the two every quarter.
Generator: your brand as a regular expression
Enter your brand and its variants. The generator writes the “Brand or non-brand” calculated field, the regular expression on its own for filters and, if you enter language folders, the “Page language” field. Everything is calculated in your browser: nothing is sent.
Add common typos and the names of your flagship products. Avoid common words on their own: “lumen” by itself would catch queries that have nothing to do with you.
“Brand or non-brand” calculated field (GSC site source)
Regular expression only (Regexp Contains filter in Data Studio, regex query filter in Search Console)
“Page language” calculated field (GSC URL source)
Query intent
This field sorts English queries into five groups based on words you can spot, following the examples Google gives for its regular expression filters (question words, buying words). Our article on search intent explains how the words in a query signal intent. The French version of this guide uses French keywords; adapt the lists to the language of your queries.
Field name: Query intent (GSC site source)
CASE
  WHEN IFNULL(Query, "") = "" THEN "Hidden queries"
  WHEN REGEXP_CONTAINS(Query, "(?i)^(how|why|when|what|which|who|where|can|does|do|is|are|should)( |$)|(^| )how (much|many)|[?]") THEN "Question"
  WHEN REGEXP_CONTAINS(Query, "(?i)(^| )(price|prices|pricing|cost|costs|quote|buy|cheap|deals?|discounts?|subscriptions?)( |$)") THEN "Price and purchase"
  WHEN REGEXP_CONTAINS(Query, "(?i) vs | versus |comparison|(^| )best( |$)|alternative|(^| )reviews?( |$)") THEN "Comparison and reviews"
  WHEN REGEXP_CONTAINS(Query, "(?i)(^| )(near|nearby)( |$)|(^| )open( now)?( |$)") THEN "Local"
  ELSE "Other"
END
Order matters: Data Studio returns the first true condition, so “how much does a quote cost” ends up as “Question.” The words spotted must be whole words, surrounded by spaces or placed at the start or end of the query: “however,” “whatsapp,” “costume” or “preview” are therefore not classified. Add the cities in your area to the “Local” line.
Query length
This field sorts queries by number of words, to isolate long-tail queries.
Field name: Query length (GSC site source)
CASE
  WHEN IFNULL(Query, "") = "" THEN "Hidden queries"
  WHEN REGEXP_MATCH(Query, "[^ ]+( [^ ]+)?") THEN "1 to 2 words"
  WHEN REGEXP_MATCH(Query, "[^ ]+( [^ ]+){2,3}") THEN "3 to 4 words"
  ELSE "5 words or more"
END
REGEXP_MATCH is intentional here: the expression describes the whole query, one word followed by “space and word” groups.
Page path
This field removes the protocol and domain from the address. Google gives a version for .com domains; this one accepts every extension.
Field name: Page path (GSC URL source)
REGEXP_REPLACE(Landing Page, "^https?://[^/]+", "")
Site section
This field groups pages by section. Replace the folders in the example with yours, from the most specific to the broadest.
Field name: Site section (GSC URL source)
CASE
  WHEN REGEXP_MATCH(Landing Page, "https?://[^/]+/?([?#].*)?") THEN "Home"
  WHEN REGEXP_CONTAINS(Landing Page, "/blog/") THEN "Blog"
  WHEN REGEXP_CONTAINS(Landing Page, "/products?/|/shop/") THEN "Products"
  WHEN REGEXP_CONTAINS(Landing Page, "/contact|/quote|/pricing/") THEN "Contact and quotes"
  ELSE "Other pages"
END
This variant returns the first folder of each address, which is useful for discovering a site’s structure:
REGEXP_EXTRACT(Landing Page, "^https?://[^/]+/([^/?#]+)/")
Page language
On a multilingual site with one folder per language, this field gives the language of each page and feeds page 6. Put your own folders in the list; the original language takes the ELSE value.
Field name: Page language (GSC URL source)
CASE
  WHEN REGEXP_CONTAINS(Landing Page, "^https?://[^/]+/(fr|nl|de|es|it)(/|$)") THEN REGEXP_EXTRACT(Landing Page, "^https?://[^/]+/(fr|nl|de|es|it)(/|$)")
  ELSE "en"
END
Both branches return text, as Data Studio requires for every THEN branch of the same CASE.
Step 3. Save the filters
A filter works on every chart that uses the same data source, and only on those. The “Blog section” and “Pages in French” filters are created on “GSC URL,” the six others on “GSC site.” To add one, select the chart, open the SETUP tab of the Properties panel and click ADD A FILTER; the Resource menu, then Manage filters, lists them all.
Each block gives the filter name, Include or Exclude, the field, the condition and the value. The conditions use the names shown in the English interface: Equal to (=), Is Null, Between (>=&&<=), Greater than or equal to (>=), Regexp Contains, Regexp Match.
No hidden queries | Exclude | Query | Is Null
Non-brand | Include | Brand or non-brand | Equal to (=) | Non-brand
Brand | Include | Brand or non-brand | Equal to (=) | Brand
Questions | Include | Query intent | Equal to (=) | Question
Positions 11 to 20 | Include | Average Position | Between (>=&&<=) | 11 to 20
AND | Include | Impressions | Greater than or equal to (>=) | 100
Blog section | Include | Landing Page | Regexp Contains | /blog/
Pages in French | Include | Page language | Equal to (=) | fr
Queries of 5 words or more | Include | Query | Regexp Match | [^ ]+( [^ ]+){4,}
Two Data Studio rules to remember: text comparisons are case-sensitive (a regular expression that starts with (?i) removes that constraint), and the Regexp Match condition requires the whole value to match. The 100-impression threshold is a starting point: lower it to 20 on a small site and raise it on a large one.
Step 4. Build the six pages
For a dashboard viewed on a phone, Google recommends the “Fit to width” display mode in the report’s layout settings, then checking how it renders on several screens. Place the controls at the top of page 1 and repeat them on the other pages. Each source has its own Search Type parameter: on pages 4 and 6, choose the one from the “GSC URL” source.
Page 1, overview
Source: GSC site. At the top, a date range control (Google’s template shows the last 28 days compared with the previous 28 by default), a drop-down list on the Search Type parameter and two lists on the device and country fields.
For the search type list, Google’s help says: Add a control, Drop-down list, then, in the SETUP tab of the Properties panel, the Search Type parameter as the control field.
Add four key figures (scorecard charts: clicks, impressions, site CTR, average position) compared with the previous period, and a time series of clicks and CTR. Google recommends a period that is a multiple of 7 days, because weekdays and weekends don’t follow the same pattern.
Page 2, brand and non-brand
Source: GSC site. A time series of clicks with Brand or non-brand as the breakdown dimension, then a table of the two segments with the four metrics. Apply the “No hidden queries” filter to both charts.
Read the gap between the lines. If total clicks drop while non-brand clicks stay stable, the drop comes from searches for your name: look at your brand awareness and your campaigns first. If non-brand clicks are the ones dropping, open page 4 to find the pages affected.
Page 3, queries
Source: GSC site. A table with Query, Query intent and Query length as dimensions, the four metrics, sorted by clicks, and a bar chart of clicks by intent.
A control on Query intent lets you show only questions; a question with impressions and few clicks can point to an article worth writing.
Page 4, pages
Source: GSC URL. A table with Page path and Site section as dimensions, the clicks, impressions, CTR and position from the URL table as metrics, and the comparison with the previous period: the difference column shows the pages that are losing clicks. A control on Site section isolates one section; Google notes that the page filter in its own template accepts regular expressions, like the “Blog section” filter.
Page 5, opportunities
Source: GSC site. The centerpiece is the bubble chart described in the Search Central documentation: one bubble per query, site CTR on the x-axis, average position on the y-axis, size by clicks, color by device. Google recommends reversing the position axis (position 1 at the top), switching both axes to a logarithmic scale and adding reference lines at the average.
According to Google, queries with a good CTR but a low position are the ones to work on first; those that rank well with a low CTR call for a look at the results page (competitors’ rich results, a query of no interest to your readers). With AI Overviews, a low CTR at a good position can also come from the answer shown above the links.
Below it, a table of queries with the “Positions 11 to 20” filter: you’re already visible there, just past the first page.
Page 6, languages, countries and Discover
Source: GSC URL. A pivot table with Page language in rows, countries in columns and clicks as the value; on a single-language site, keep the country table.
For Discover, duplicate the “GSC URL” source (Resource menu, Manage added data sources, then Duplicate): according to Google’s help, the copy keeps the calculated fields. Reconnect the copy with the discover search type and name it “GSC Discover,” then duplicate the table from page 4 and switch it to this source. A Search Type list set to discover would also change the language table, since page 6 only reads the “GSC URL” source. The Search Central blog notes that the connector has covered Discover and Google News since March 30, 2022.
The connector only sees Google: visits from Bing are tracked in Bing Webmaster Tools. For those sent by ChatGPT or Perplexity, use Google Analytics 4 and the regex in our guide to AI traffic in GA4.
Why do the figures differ from Search Console?
Four causes, all documented by Google, explain almost every gap.
First, the calculation method: compare a Data Studio figure with the Search Console view that uses the same aggregation (site or page).
Second, anonymized queries, entered by fewer than a few dozen people over two to three months according to Google’s October 2022 article. They count in the totals, don’t appear as detailed queries (Data Studio can group them in a blank row, the one the Brand or non-brand field files under “Hidden queries”) and disappear as soon as a filter applies to the query. In Google’s example, a site has 550 clicks in total and 450 on the listed queries; the filters “contains fiction” and “doesn’t contain fiction” give 175 and 275 clicks, or 450. Your Brand and Non-brand segments added together will therefore stay below the total on page 1.
Row volume matters too: in October 2022, Google said that the Search Analytics API and the connector return at most 50,000 rows per day, per site and per search type. Only a very large site gets close.
Finally, the delay: Data Studio refreshes Search Console data every 12 hours, with no way to change it, and Search Console’s most recent data is provisional.
For average position, Google uses your site’s highest result: don’t average several average positions.
A template to copy, or your own version?
Google publishes a tracking template, presented on the Search Central blog on March 30, 2022, and the connector’s help points to the template gallery, Search Console category. According to Google’s description, this template brings together the controls (property, period, page, type, country, device), a clicks and CTR chart and a table of URLs; the description mentions neither a brand field nor a classification of queries by intent.
To go further (queries grouped by topic, a category for each page), Google shows in a March 2023 article how to join a table you maintain yourself to the Search Console source, by blending data.
Checklist before you send the link
- Two sources (site and URL) with clear names.
- The right credentials: owner for broad sharing, viewer for a team that already has access.
- Every formula saved without a warning, every field name turned into a chip.
- A default period that is a multiple of 7 days, compared with the previous period.
- The Brand and Non-brand segments checked against the site’s top twenty queries.
- Hidden queries excluded from the query tables.
- Rendering checked on a phone.
- A note on the first page reminding readers that the most recent data is provisional.
Tracking a site in several languages
Page 6 shows whether your translated versions are finding their audience. When they stall, the causes are often technical: indexing, addresses by language, hreflang tags. Our article on SEO for a multilingual site covers these points in detail. For a site preparing new languages, the MACCUS multilingual SEO service starts with a first pass on indexing, addresses, hreflang tags and pages that already rank, before drawing up the quote.